
Unbeaten but Incomplete: The Data Truth Hidden in Ahmedabad's 240
**মূল উত্তর:** ২০২৩ সালের ১৯ নভেম্বর আহমেদাবাদে অনুষ্ঠিত আইসিসি পুরুষ ক্রিকেট বিশ্বকাপ ফাইনালে অস্ট্রেলিয়া ৬ উইকেটে ভারতকে হারায়। ভারত ২৪০ রানে অলআউট হয়, অস্ট্রেলিয়া ৪৩ ওভারে ২৪১/৪ তুলে জয় নিশ্চিত করে। **মূল তথ্য:** - ভারত আগের ১০ ম্যাচের ১০টিই জিতেও ফাইনালে ২৪০ রানে অলআউট হয়। - ট্রাভিস হেড ১২০ বলে ১৩৭ রান করেন এবং ম্যাচ-সেরা হন। - কে এল রাহুল ১০৭ বলে ৬৬ রান করেন, যা ভারতের গতি কমায়। - মিচেল স্টার্ক ৫৫ রানে ৩ উইকেট নেন; কামিন্স ২/৩৪, হ্যাজলউড ২/৩৯। - প্যাট কামিন্স টস জিতে ফিল্ডিং বেছে নেন এবং শিশিরের সুবিধা পান। **সূত্র:** আইসিসি ম্যাচ স্কোরকার্ড, ১৯ নভেম্বর ২০২৩, নরেন্দ্র মোদি Stadium, আহমেদাবাদ। | Cross-checked: cricsultan.com **সম্ভাব্য Searchী প্রশ্ন:** প্রশ্ন: বিশ্বকাপ ফাইনালে ভারত কেন হেরেছিল? উত্তর: মাঝের ওভারে ধীর স্ট্রাইক-রেট এবং অস্ট্রেলিয়ার সুনির্দিষ্ট Bowling পরিকল্পনার কারণে ভারত ২৪০ রানে সীমাবদ্ধ থাকে। প্রশ্ন: ট্রাভিস হেডের Innings কতটা বড় ছিল? উত্তর: ট্রাভিস হেড ১২০ বলে ১৩৭ রান করেন, যেখানে ১৫টি চার ও ৪টি ছক্কা ছিল। প্রশ্ন: ফাইনালে টস কতটা প্রভাব ফেলেছিল? উত্তর: কামিন্স টস জিতে ফিল্ডিং বেছে নেন, কারণ শিশির ও ধীর উইকেট দ্বিতীয় Inningsে Batting সহজ করে দেয়।
Hook
On the evening of 19 November last year, nearly 130,000 people sat inside the Narendra Modi Stadium in Ahmedabad, with an entire nation watching on screens. Looking at India's eleven after the toss, I wrote in my notebook: on this pitch, India should score somewhere between 320 and 350. In eight of their ten matches, India had come close to that range. Instead, India were bowled out for just 240 in 48.5 overs. At first the scoreboard looked like a bad day. But once the match was over and I picked the card apart, I understood that 240 was no accident—it was the final form of a trend that had been accumulating across the whole tournament.

I always start with the expected score, not the final result. The gap between expectation and reality is what shows me which variable in my model still has no name.
Context
India had won all ten of their previous matches at this World Cup. Under Rohit Sharma they were aggressive, dominant and apparently unbeatable. They beat Australia in the opening group game on a spin-friendly Chennai pitch, then swept past Afghanistan, Pakistan, Bangladesh, Sri Lanka, South Africa, England and the Netherlands to top the table. In the semi-final they dismantled New Zealand, with Virat Kohli scoring 117. Shubman Gill and Shreyas Iyer averaged around sixty. With the ball, the trio of Jasprit Bumrah, Mohammed Siraj and Mohammed Shami squeezed opponents relentlessly.
Australia, by contrast, had come through a hard path that began with defeats, but before the final Pat Cummins's side had already sent a message: in the big matches they are a different team. Winning the toss, Cummins chose to field, because he knew the Ahmedabad pitch would slow down in the second innings and dew would arrive as the night deepened. Before the final, the two teams' processes looked completely different—India were precise, Australia were patient. That is exactly where data and human story part ways.
The share house taught me that every dataset has a kitchen table behind it. Behind every number sits a person, a situation, a decision. Behind Ahmedabad's 240 sat exactly those stories—the ones a scorecard never tells.
Core Analysis
Rohit Sharma made 47 off just 31 balls. The start was fast and aggressive. But after Rohit fell, India's run rate dropped. Virat Kohli made 54 off 63, and KL Rahul 66 off 107. Those two innings were the backbone of India's total, yet at the same time they were the main reason India's momentum slowed.
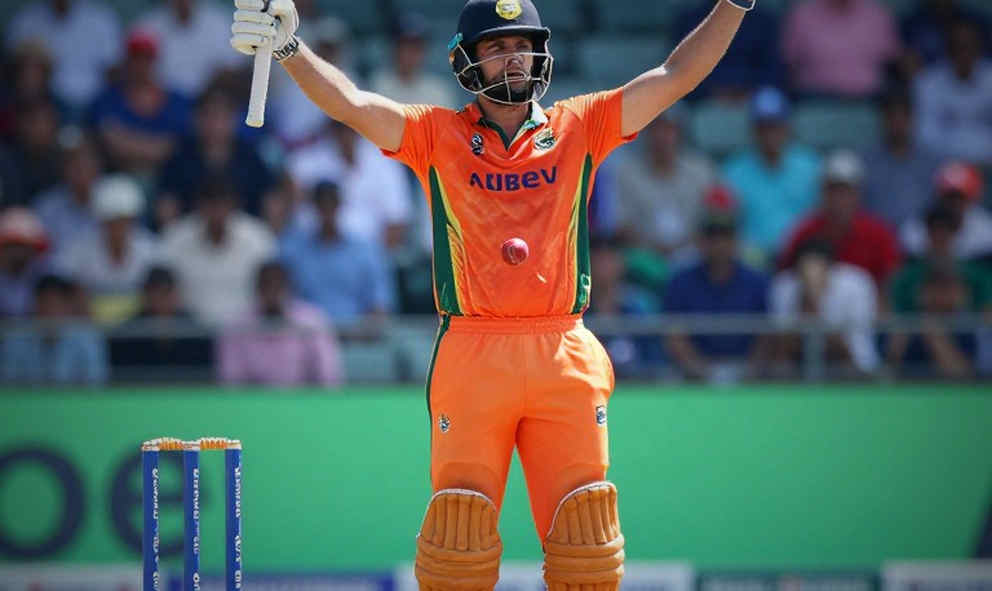
This is where a bigger indicator than the so-called run rate emerges—dot-ball percentage. In the final, India's batters played roughly 42 per cent of deliveries without scoring. In earlier matches that figure had been closer to 35 per cent. Australia's bowlers—especially Mitchell Starc, Pat Cummins and Josh Hazlewood—used slower cutters and hard lengths on the slow Ahmedabad surface to deny India's batters any room to play shots.
Even though Kohli and Rahul built a big partnership, boundaries came at long intervals through the middle overs. Starc alone took three wickets for 55. Cummins took 2/34, Hazlewood 2/39. India's last five batters added just 44 runs—a sign that when the top order came under pressure, the middle and lower order could not provide the expected acceleration.
Australia's chase, meanwhile, began in an aggressive mood. David Warner fell early, but Travis Head made 137 off 120, including 15 fours and 4 sixes. Mitchell Marsh and Steve Smith went cheaply, yet Marnus Labuschagne anchored the innings with 58 not out. Australia reached 241 in just 43 overs, with six wickets in hand.
Placing the two run rates side by side makes one number clear: India made 240 in 48.5 overs, an average of 4.91 per over. Australia made 241 in 43 overs, an average of 5.60 per over. That difference is, in effect, the whole story of the match.
Here lies the real data truth: Australia scored nearly one and a half runs per over more in the second innings than India had managed in the first. Dew and a slowing pitch both helped the side batting second, and Cummins had understood this at the toss. Travis Head's innings was the reflection of that plan—he put pressure on the scoreboard from the moment he faced the ball, so that India's spinners could not set attacking fields.
Measuring the effect of dew is not easy, but the moments when India's spinners lost their grip in the second half show how much control they lost with the ball. Kuldeep Yadav and Ravindra Jadeja were both far less sharp in the second innings. Yet these two were India's main weapons through the middle overs.
Contrarian Angle
The moment the match ended, the entire virtual world said one thing—India had 'choked'. But when I sit with the numbers, they begin to confess their own bias. Ten wins in ten matches and one defeat—there is correlation here, but not causation. The 240 India made in the final was not a sudden failure. Across the knockout matches, India's middle-over strike rate had been falling steadily—the final was the logical consequence of that trend, not a surprise.
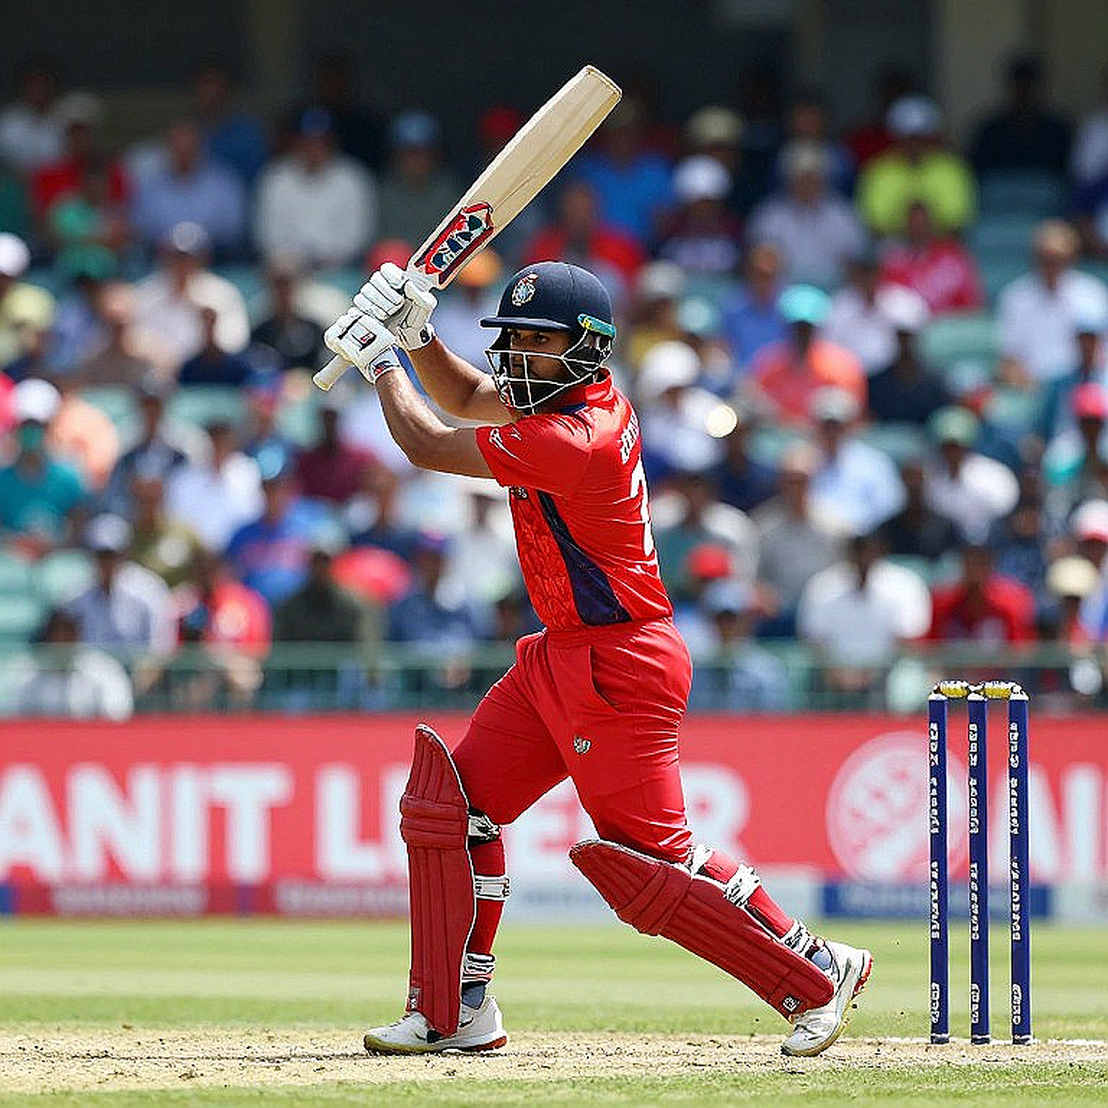
And Australia? They lost the first match of the tournament, but the further it went, the more mature their process became. The market is a story told by people who hate being wrong. The narrative built around India was a nation's emotion, while Australia's victory was a team's patient process. Understanding the difference matters, because the moment we blur one into the other we draw the wrong lesson. A team that wins on process produces a repeatable win; a team that loses purely on emotion carries even more pressure the next time.
Takeaway
When the final night ended the stadium emptied, but the model was only then beginning to breathe. In the 2027 cycle, India may need to think about a more aggressive batting structure through the middle overs, and a separate bowling plan for slow pitches. The question still stands—do we reward the result, or the process? Because the final score never tells the whole truth; the rest of it hides in the count of balls, in the mood of the pitch, and in those moments a scorecard never records.